Biggest cities by population in the world: Tokyo Population 2023
Tokyo Population 2023
Tokyo’s 2023 population is now estimated at 36,014,032. In 1950, the population of Tokyo was 11,274,641. Tokyo has grown by -118,412 in the last year, which represents a -0.33% annual change. These population estimates and projections come from the latest revision of the UN World Urbanization Prospects. These estimates represent the Urban agglomeration of Tokyo, which typically includes Tokyo’s population in addition to adjacent suburban areas.
According to recent estimates, the 23 wards that make up the city of Tokyo had an approximate 2016 population of 9,262,046. The 23 wards made up the boundaries of the historic city of Tokyo, which was officially dissolved in 1943 when it merged with the prefecture. Today, Tokyo extends way beyond the original city boundaries, and is one of the largest urban sprawls in the world, which doesn’t make it easy to explain exactly how many people live in Tokyo.
Expansion of Tokyo
The Tokyo prefecture, into which Tokyo city was merged, was home to 13,047,446 people in 2010. But the story doesn’t end there — the Tokyo urban area extends beyond even the prefecture’s boundaries.
According to a 2016 estimate of Tokyo’s population, the metropolis is now home to 13.5 million people, or 9,262,046 in all of the 23 wards. This does not include the population of the metro area, which we will get into in a moment.
The population of Tokyo may be a bit hard to understand because of the way the figures are laid out. The 23 wards claim a population of 9.2 million, but the metropolis has a population that exceeds 13 million. The greater Tokyo metropolitan area, which is spread over 3 prefectures, is much larger and has a population that is estimated to be over 36 million. That means the greater Tokyo area is home to 25% of Japan’s population, and it’s the most populous metropolitan area in the world. The metropolitan area is so large, in fact, that it is 1.5 times larger than the world’s next largest metropolitan area, Seoul.
By any measure, Tokyo is the largest city in Japan. Its 23 wards are almost three times as large as Yokohama, Japan’s second city, which has around 3.7 million residents.
City Size and Population Density
The surface area of the city metropolis comes to approximately 2,187.66 km2 (844.66 square miles). However, the city expands outwards to approximately 13,572 km2 (5,240 square miles). Quite the impressive sprawl. Now, to find the rough population density of the Tokyo area, we combine the total population with the available space for the residents, which comes to 6,224.66 people living per square kilometer (16,121.8 residents per square mile).
Tokyo Population History
Tokyo has always been Japan’s largest city, and one of the mightiest cities in Asia, if not the world. It used to be known as Edo, and grew from a small village to become, in the 1720s, the first city in Asia with a population of more than 1 million people. Renamed Tokyo in 1868, the city continued to grow rapidly. By 1900, its population had passed 2 million for the first time, and by the start of the 1940s, the wider metropolitan area was home to more than 7 million people.
World War II saw the only major population decline in the city’s history (although there have been other smaller declines over the years.) Tokyo’s population halved in just five years, and when Japan surrendered in 1945, its population was just 3.5 million. Gradual attrition accounted for much of the decline, although the massive Allied air raids also took a staggering toll – at least 100,000 were killed in the US Air Force firebombing of Tokyo on March 9 1945, and around a million were estimated to have been left homeless.
The population rapidly grew again after the war, perhaps indicating that many of its residents had temporarily left the city. It took less than a decade for the city to recover to its pre-war population levels, and in 1956, Tokyo’s population passed 8 million for the first time. Since then, growth has been steady, rather than spectacular, and although Tokyo’s economy has (like Japan’s) under-performed in recent years, its population continues to slowly rise.
The latest census data, used above, is from 2010. There is no firm data on the population of Tokyo in 2016, so the figures listed here are estimates based on the city’s growth rate and preliminary 2015 census figures.
Tokyo Demographics
Tokyo is a major commuter city. That means that many of the people in the city at any one time don’t actually live in the city itself; they commute in each day for work. In 2015, the Tokyo Metropolitan Government estimated the nighttime and daytime population of the city, finding that although the city’s population was around 15.576 million in the daytime, this decreased to 13.159 million in the middle of the night. That means that, every day, approximately 2,400,000 people commute into Tokyo.
When it comes to working age people, the labor force is divided as follows: Clerical, Technical and Management (42.3%), Sales and Services (26.2%), Manufacturing and Transport (17.7%) and Agriculture, Forestry and Fisheries (0.4%).
Tokyo is, by most measures, the richest city in the world. Its total GDP in 2007 was $1.9 billion; that’s over $300 million higher than the next richest city, New York. When adjusted for Purchasing Power Parity (PPP) the difference between Tokyo and New York narrows : in 2005 Tokyo had a PPP GDP of $1.617 billion, compared to $1.403 for New York.
The age breakdown of Tokyo’s population is, as you would expect, skewed toward working age. The most recent official demographics for Tokyo were released in 2010, and they show that 68.2% of Tokyo residents are aged 15-64. Befitting a country with one of the world’s longest life expectancies, there is also a high proportion of retired people in Tokyo: 20.4% of people were aged 65 or over. The remaining 11.4% of residents are children aged 0-14.
Life expectancy in Tokyo aligns with the national average of 78.8 years. Men in Tokyo can expect to live for 79.59 years and women for 86.35 years.
Tokyo Population Growth
Japan as a country is expected to rapidly decline in population thanks to little immigration, a rapidly aging population and a very low fertility rate. Japan is today the oldest country in the world, and Tokyo is no exception to the trends the country as a whole is following.
A recent study by the Tokyo Metropolitan Government, which included a group of academics and city officials, estimated the population of Tokyo in 2100. The group estimates that Tokyo’s population will be just 7.13 million, compared to 13.16 million as of the 2010 census. They also predicted the city will peak at 13.35 million in 2020 before a relentless downslide. Meanwhile, Japan’s population as a whole will decline by over 61% by 2100.
Meanwhile, the Japan Times forecasted that the entire population of the Prefecture of Tokyo, which is the central jurisdiction of the metropolitan region, will be cut in half between 2010 and 2100.
This means that Tokyo’s population is expected to halve in the next 90 years, and by 2100, 3.27 million of the 7.13 million residents in the city will be over the age of 65. The working population of the country, which is largely concentrated in Tokyo, will age, and Tokyo’s place as an international city will be at risk.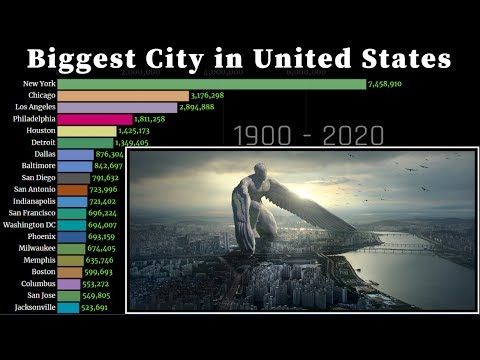
Sao Paulo Population 2023
Sao Paulo’s 2023 population is now estimated at 24,490,136. In 1950, the population of Sao Paulo was 2,334,038. Sao Paulo has grown by 119,300 in the last year, which represents a 0.49% annual change. These population estimates and projections come from the latest revision of the UN World Urbanization Prospects. These estimates represent the Urban agglomeration of Sao Paulo, which typically includes Sao Paulo’s population in addition to adjacent suburban areas.
São Paulo refers to both a state and city in Brazil, but this article will only cover the scope of the city itself. As of 2016, it had an urban population of 11,967,825.
São Paulo is the largest city of Brazil and the largest city proper in the Americas and the southern hemisphere. It’s also one of the top 10 largest metropolitan areas in the world. São Paulo is a global city with a strong influence in the arts, entertainment, finance and commerce, and the city hosts the largest gay pride parade in the world. Known colloquially as Sampa or Cidade da Garoa (city of drizzle), the municipality had a 2011 population of 11.31 million.
The 2018 population of São Paulo is estimated at over 12 million residents.
At the 2010 IBGE Census, São Paulo was home to 10,659,386 people, a figure that is estimated to have grown to 11.9 million in 2016. The density in the city proper is 7,216.3 people per square kilometer (18,690 per square mile), but the metropolitan region is home to over 21 million people, with a much lower density of 2,469 people per square kilometer.
Greater São Paulo actually has many definitions, but the legal definition of Região Metropolitana de São Paulo has 39 municipalities with a 2016 estimated population of 21 million people. This definition includes 38 smaller cities around São Paulo. Because the city has such a huge urban sprawl, there is another definition for its metropolitan area: Complexo Metropolitano Expandido, which is the same as a Combined Statistical Area in the United States. By this definition, greater São Paulo is the third largest city in the world with more than 27 million residents.
Historical Immigration into São Paulo
São Paulo residents, known as Paulistanos, are some of the most ethnically diverse in the country. At the end of slave trafficking in Brazil in 1850, the city replaced African labor with voluntary immigrants to work its coffee plantations. This brought in a wave of German, Portuguese and Swiss immigrants, followed by additional waves of Portuguese and Italian immigrants from the mid-19th century through the beginning of the 20th century.
This means the state of São Paulo has one of the largest immigrant communities in Brazil. When slavery was abolished in 1888, the city received huge swells of European immigrants, and by 1897, Italians accounted for more than 50% of São Paulo’s population. From 1908 to 1941, a large number of Japanese immigrants arrived, while Koreans and Chinese moved to the region in the 1960’s. In present day, São Paulo is seeing a huge wave of migration from Bolivia.
In 1920, the Governor of São Paulo even noted the city’s huge immigrant population by saying, “If the owner of each house in São Paulo display the flag of the country of origin on the roof, from above São Paulo would look like an Italian city.”
São Paulo Demographics
São Paulo is still a city of immigrants today, and a study by the University of São Paulo shows the diversity. 81% of students said they were descendants of foreign immigrants, with the most common ancestry groups being: Italian (30.5%), Portuguese (23%), Spanish (14%), Japanese (8%), German (5.6%), African (2.8%), Arab (2.4%) and Jewish (1.2%).
In the metropolitan area, there are:
- 6 million of Italian descent
- 3 million of Portuguese descent
- 1.7 mllion of African descent
- 1 million of Arab descent
- 665,000 of Japanese descent
- 400,000 of German descent
- 250,000 of French descent
- 150,000 of Greek descent
- 120,000 of Chinese descent
- 120,000 to 300,000 Bolivian immigrants
- 50,000 of Korean descent and
- 40,000 Jews
The ethnic breakdown of São Paulo according to the 2010 Census was 65. 6% white, 26.5% brown or mixed people, 5.5% black, 2.2% Asian and 0.2% Amerindian.
São Paulo Population Growth
From 1950 to 1975, São Paulo was one of the fastest growing urban areas on earth. From 1980 to 2000, it also ranked 4th in population among the urban areas of the world, but it has since been displaced from this list by the unprecedented growth in areas like Delhi. The state of São Paulo has more than 44 million residents in 2016,) which is more than the US state of California in an area with just 2/3 the land.
São Paulo’s central city continues to grow, and in the last decade, it has grown by over one million. 57% of its urban area population still lives in the central city, but growth in the suburbs is picking up. While the speed at which the central city grew began to slow in the 1980s, the suburban growth has climbed steadily since the 1960s with no sign of slowing.
By 2030, the United Nations projects São Paulo will have a population of over 23 million people, approximately 10 million more people than Rio.
Sao Paulo Population 2023
Sao Paulo Population Data (Urban Area)
Other Cities in Brazil
- Brazilian Institute of Geography and Statistics – Sao Paolo data and statistics
- Portal Brazil – Brazil information and data
Sources
The largest cities in the world by population 2021 (update 2020) list. Largest cities, table
There are 81 cities in the world.
Of the largest cities below, 33 are megacities with a population of more than 10 million, of which 6 are cities with a population of more than 20 million.
Tokyo (Japan) – the largest city in the world with a population of 37,400,068 people according to [1 – Wikipedia]. Next comes Delhi (India) with a population of 28,514,000. The third largest city in the world is Shanghai with a population of 25,582,000. nine0005 There are two Russian cities in the list of the largest cities in the world in terms of population: Moscow at 24 positions and St. Petersburg at 74.
In total, there are 20 cities in China with a population of more than 5 million people. India and USA by 9.
Definitions and source of data
According to [1]: Population data is presented according to the UN (United Nations) estimate, which uses its three criteria to define the city, since not all cities in all jurisdictions are classified using the same criteria. Cities can be defined as cities themselves (within administrative boundaries), their urban areas (formally not included in the administrative boundaries of a city in a particular country) and regional agglomerations are also considered. nine0005 The largest city by population within local government boundaries is Chongqing, China with a population of 30,165,500. The municipality of Chongqing (Chongqing within administrative boundaries), which is roughly the size of Austria, has the largest population in the world. However, more than 70% of its inhabitants actually live in rural areas.
The population of Tokyo within the administrative boundaries is 13,515,271 people.
In addition to the data on the population of the largest cities in the world, the table provides data on the area of urban areas in square kilometers. nine0005 Urban area – an area with an increased density of man-made structures compared to the areas around it. Urban areas can be cities or agglomerations, but usually this concept does not apply to villages or rural settlements, such as villages or farms.
Urban area – can be defined as a conditionally contiguous urban area without regard to territorial or other boundaries within an urban area.
Enlarge. Tokyo is the largest city in the world, its territory exceeds the administrative boundaries of the city. nine0035 China

Arabia
Photos of some cities
The largest cities in the world by population
Home > Directory > Lists and ratings > Cities > The largest cities in the world by population
The current list of the largest cities in the world by population and area was compiled in 2017. Important: in the population of each city, we did not take into account suburbs and agglomerations. Among the CIS countries, the only city that was included in the list of the largest was Moscow. The rating is updated regularly. nine0003
- 2017
- 2015
| No. | City | Country | The density of the population (people/sq. Km) | population (people) |
|---|---|---|---|---|
| 1 | Shanghai | China | 3. 814 814 | 24 183 300 |
| 2 | Beijing | China | 1.267 | 21 707 000 |
| 3 | Lagos | Nigeria | 13.712 | 16 060 303 |
| 4 | Istanbul | Turkey | 24.231 | 15 029 231 |
| 5 | Karachi | Pakistan | 3.944 | 14 910 352 |
| 6 | Guangzhou | China | 1.76 | 13 081 000 |
| 7 | Shenzhen | China | 6.889 | 12 528 300 |
| 8 | Mumbai | India | 28.426 | 12 442 373 |
| 9 | Moscow | Russia | 11.969 | 12 229 000 |
| 10 | Sao Paulo | Brazil | 11.199 | 12 038 000 |
| 11 | Kinshasa | DR Congo | 24. 195 195 | 11 462 000 |
| 12 | Tianjin | China | 944 | 11 249 000 |
| 13 | Lahore | Pakistan | 22.139 | 11 126 000 |
| 14 | Delhi | India | 23.893 | 11 034 555 |
| 15 | Jakarta | Indonesia | 16.06 | 10 624 000 |
| 16 | Dongguan | China | 4.315 | 10 615 000 |
| 17 | Seoul | South Korea | 16.202 | 9 806 000 |
| 18 | Foshan | China | 2.444 | 9 279 000 |
| 19 | Tokyo | Japan | 14.79 | 9 273 000 |
| 20 | Chengdu | China | 630 | 9 012 000 |
| 21 | Lima | Peru | 3. 329 329 | 8 894 000 |
| 22 | Mexico | Mexico | 14.616 | 8 875 000 |
| 23 | London | UK | 5.614 | 8 825 001 |
| 24 | Tehran | Iran | 15.143 | 8 694 000 |
| 25 | New York | USA | 10.966 | 8 622 698 |
| 26 | Bangalore | India | 11.909 | 8 443 675 |
| 27 | Shenyang | China | 625 | 8 106 171 |
| 28 | Dhaka | Bangladesh | 23.888 | 8 063 000 |
| 29 | Wuhan | China | 946 | 8 035 000 |
| 30 | Bogotá | Colombia | 18.594 | 7 963 000 |
| 31 | Cairo | Egypt | 25.582 | 7 740 000 |
| 32 | Ningbo | China | 775 | 7 605 689 |
| 33 | Chongqing | China | 92 | 7 583 500 |
| 34 | Ho Chi Minh City | Vietnam | 16.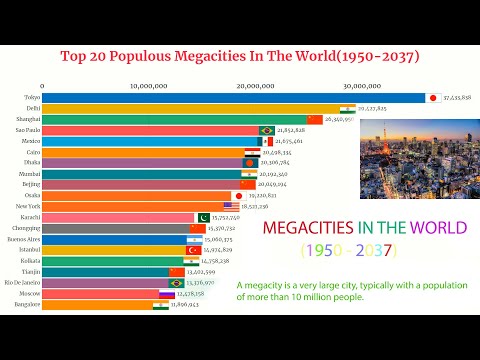 382 382 | 7 431 000 |
| 35 | Nanjing | China | 1.103 | 7 260 000 |
| 36 | Hong Kong | China | 6.608 | 7 298 600 |
| 37 | Hanoi | Vietnam | 2.176 | 7 232 700 |
| 38 | Changsha | China | 596 | 7 044 118 |
| 39 | Hangzhou | China | 8.268 | 7 035 000 |
| 40 | Ahmedabad | India | 19.991 | 7 021 000 |
| 41 | Hyderabad | India | 11.494 | 6 993 262 |
| 42 | Baghdad | Iraq | 16.001 | 6 793 000 |
| 43 | Chennai | India | 15.772 | 6,727,000 |
| 44 | Riyadh | Saudi Arabia | 16. 288 288 | 6 694 000 |
| 45 | Rio de Janeiro | Brazil | 8.677 | 6,520,000 |
| 46 | Xian | China | 614 | 6 220 000 |
| 47 | Suzhou | China | 705 | 5 983 000 |
| 48 | Surat | India | 27.916 | 5 868 000 |
| 49 | Bangkok | Thailand | 7.561 | 5 782 000 |
| 50 | Santiago | Chile | 9.339 | 5 561 000 |
| 51 | Singapore | Singapore | 9.302 | 5 607 000 |
| 52 | Shantou | China | 2.611 | 5 391 028 |
| 53 | St. Petersburg | Russia | 11.554 | 5 351 000 |
| 54 | Harbin | China | 8.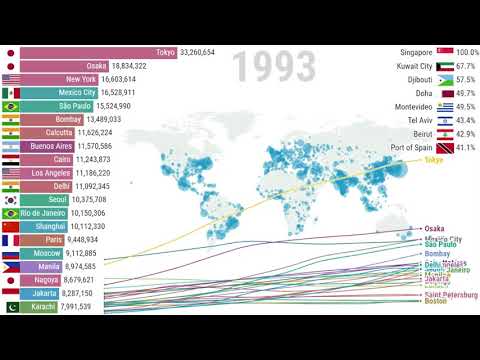 626 626 | 5 299 000 |
| 55 | Dar es Salaam | Tanzania | 15.905 | 5 257 000 |
| 56 | Yangon | Myanmar | 8.708 | 5 214 000 |
| 57 | Johannesburg | South Africa | 11.434 | 4 949 000 |
| 58 | Abidjan | Ivory Coast | 2.249 | 4 765 000 |
| 59 | Alexandria | Egypt | 2.007 | 4 616 625 |
| 60 | Kolkata | India | 24.306 | 4 496 694 |
| 61 | Ankara | Turkey | 2.34 | 4 470 800 |
| 62 | Giza | Egypt | 14.667 | 4 239 988 |
| 63 | Zhengzhou | China | 4.059 | 4 122 087 |
| 64 | Los Angeles | USA | 3. 276 276 | 3 976 322 |
| 65 | Taipei | Taiwan | 1.927 | 3 954 929 |
| 66 | Cape Town | South Africa | 1.53 | 3 740 026 |
| 67 | Yokohama | Japan | 8.517 | 3 726 167 |
| 68 | Berlin | Germany | 4.117 | 3 671 000 |
| 69 | Busan | South Korea | 10.331 | 3 590 000 |
| 70 | Xiamen | China | 2.078 | 3 531 347 |
| 71 | Jeddah | Saudi Arabia | 1.958 | 3 456 259 |
| 72 | Durban | South Africa | 1.502 | 3 442 361 |
| 73 | Kabul | Afghanistan | 12.415 | 3 414 100 |
| 74 | Casablanca | Morocco | 14. 608 608 | 3 359 818 |
| 75 | Hefei | China | 3.998 | 3 352 076 |
| 76 | Pyongyang | North Korea | 1.541 | 3 255 388 |
| 77 | Madrid | Spain | 5.294 | 3 207 247 |
| 78 | Faizalabad | Pakistan | 14.971 | 3 203 846 |
| 79 | Ekurhuleni | South Africa | 1.609 | 3 178 470 |
| 80 | Nairobi | Kenya | 4.829 | 3 138 369 |
| 81 | Zhongshan | China | 1.75 | 3 121 275 |
| 82 | Pune | India | 6.913 | 3 115 431 |
| 83 | Addis Ababa | Ethiopia | 5.889 | 3 103 673 |
| 84 | Jaipur | India | 6. |