Puerto rico climate: Puerto Rico – Climatology | Climate Change Knowledge Portal
Discover the climate and geography of Puerto Rico
Weather and climate
Best time to visit
Unlike many islands in the Caribbean, any time is really the best time to visit Puerto Rico and enjoy its tropical climate. The rainy season is from April to November, but precipitation patterns and amounts vary considerably from one part of the island to the other. Even in the rainiest areas, showers are likely to be intense but brief.
If you’re travelling from San Juan to Ponce (or vice-versa), you’ll notice an immediate difference once you reach the top of the mountain about halfway through your journey. The south tends to be drier than the north. In the mountainous region, you’ll want a light jacket or sweater, as the higher elevation means cooler temperatures.
1 June to 30 November is hurricane season, though Puerto Rico is rarely affected by hurricanes. February is an excellent time to visit Puerto Rico; when temperatures are typically cold on the mainland USA, they’re usually neither too hot nor too cool in la isla del encanto, the island of enchantment.
Required clothing
Lightweight tropical clothes. Light rainwear required. Dress clothes for finer dining and nightclub visits. Bathing suits, of course, are de rigeur for those who plan to enjoy the water! A hat and sunglasses will help protect you from the sun’s searing rays, and if you plan to snorkel or spend lots of time in the water, a long-sleeved shirt that repels UV rays is highly recommended.
Geography
Puerto Rico is an island east of the Dominican Republic and west of the British Virgin Islands. The rougher, cooler Atlantic Ocean is on the north side of the island; the calmer, warmer Caribbean Sea is on the south side. It is the smallest island in the Greater Antilles and the largest island in the Lesser Antilles. Culebra, Mona and Vieques are among several smaller islands that are part of Puerto Rican territory. The waters surrounding the island are quite deep; the Puerto Rico trench is the deepest part of the Atlantic Ocean.
The island is comparatively small, 8,959 sq km (3,459 sq miles), with a central mountain range reaching an altitude of 1,338m (4,390ft) at Cerro de Punta, and surrounded by low coastal plains. The island has remarkable geographic diversity for its size, with limestone formations in the interior, a desert in the southeastern part of the island, and the rainforest. Mangroves dominate the southern shore and are an important part of the island’s ecosystem.
San Juan, the capital, is on the northeast shore. Much of the island’s natural forest has been cleared for agriculture, but the trees in the northeast corridor are protected as a national park. One of the hot-button environmental and political issues on the island is increasing development, particularly by the tourism industry with respect to hotel and resort construction. The island’s nature conservancy, the Fideicomiso, has played a critical role in acquiring and protecting significant land and restoring properties for public visits and educational purposes.
The other main towns are Aguadilla, Arecibo, Bayamón, Caguas, Carolina, Cayey, Fajardo, Guaynabo, Mayagüez and Ponce.
Climate & Weather Averages in San Juan, Puerto Rico
Averages are for Luis Munoz Marin, which is 12 kilometers from San Juan.
Based on weather reports collected during 1985–2015.
Showing:All YearJanuaryFebruaryMarchAprilMayJuneJulyAugustSeptemberOctoberNovemberDecember
All Year Climate & Weather Averages in San Juan
High Temp: 32 °C
Low Temp: 22 °C
Mean Temp: 27 °C
Precipitation: 72.9 mm
Humidity: 75%
Dew Point: 22 °C
Wind: 11 km/h
Pressure: 1016 mbar
Visibility: 17 km
January Climate & Weather Averages in San Juan
High Temp: 28 °C
Low Temp: 22 °C
Mean Temp: 25 °C
Precipitation: 61.0 mm
Humidity: 77%
Dew Point: 21 °C
Wind: 12 km/h
Pressure: 1017 mbar
Visibility: 18 km
February Climate & Weather Averages in San Juan
High Temp: 29 °C
Low Temp: 22 °C
Mean Temp: 25 °C
Precipitation: 36.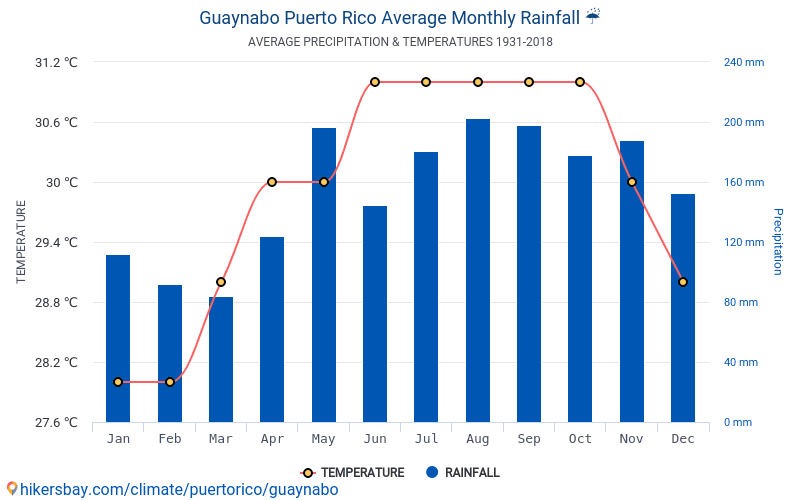 0 mm
0 mm
Humidity: 74%
Dew Point: 20 °C
Wind: 12 km/h
Pressure: 1017 mbar
Visibility: 18 km
March Climate & Weather Averages in San Juan
High Temp: 29 °C
Low Temp: 22 °C
Mean Temp: 26 °C
Precipitation: 28.1 mm
Humidity: 72%
Dew Point: 20 °C
Wind: 12 km/h
Pressure: 1016 mbar
Visibility: 18 km
April Climate & Weather Averages in San Juan
High Temp: 30 °C
Low Temp: 23 °C
Mean Temp: 27 °C
Precipitation: 53.1 mm
Humidity: 73%
Dew Point: 21 °C
Wind: 12 km/h
Pressure: 1015 mbar
Visibility: 18 km
May Climate & Weather Averages in San Juan
High Temp: 31 °C
Low Temp: 24 °C
Mean Temp: 27 °C
Precipitation: 75.9 mm
Humidity: 76%
Dew Point: 23 °C
Wind: 12 km/h
Pressure: 1015 mbar
Visibility: 17 km
June Climate & Weather Averages in San Juan
High Temp: 32 °C
Low Temp: 25 °C
Mean Temp: 28 °C
Precipitation: 64.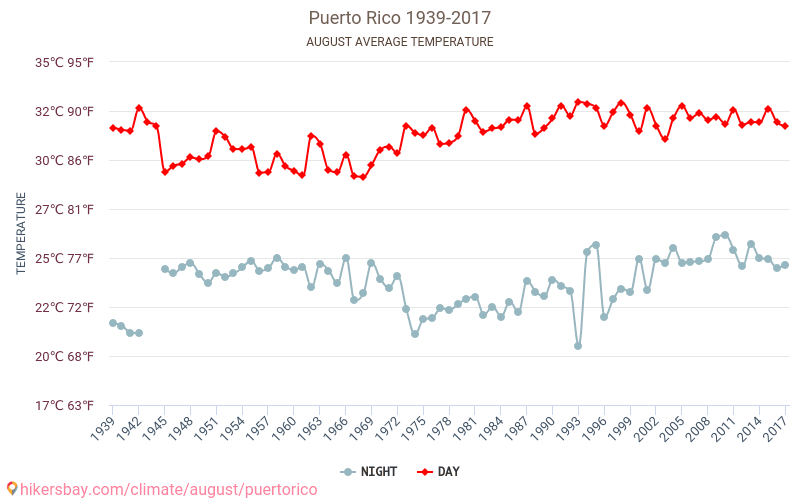 7 mm
7 mm
Humidity: 75%
Dew Point: 23 °C
Wind: 13 km/h
Pressure: 1017 mbar
Visibility: 17 km
July Climate & Weather Averages in San Juan
High Temp: 32 °C
Low Temp: 25 °C
Mean Temp: 28 °C
Precipitation: 88.5 mm
Humidity: 76%
Dew Point: 24 °C
Wind: 14 km/h
Pressure: 1017 mbar
Visibility: 17 km
August Climate & Weather Averages in San Juan
High Temp: 32 °C
Low Temp: 25 °C
Mean Temp: 28 °C
Precipitation: 97.5 mm
Humidity: 77%
Dew Point: 24 °C
Wind: 12 km/h
Pressure: 1015 mbar
Visibility: 17 km
September Climate & Weather Averages in San Juan
High Temp: 32 °C
Low Temp: 25 °C
Mean Temp: 28 °C
Precipitation: 87.5 mm
Humidity: 76%
Dew Point: 24 °C
Wind: 10 km/h
Pressure: 1014 mbar
Visibility: 17 km
October Climate & Weather Averages in San Juan
High Temp: 32 °C
Low Temp: 25 °C
Mean Temp: 28 °C
Precipitation: 83. 3 mm
3 mm
Humidity: 76%
Dew Point: 23 °C
Wind: 8 km/h
Pressure: 1013 mbar
Visibility: 17 km
November Climate & Weather Averages in San Juan
High Temp: 30 °C
Low Temp: 24 °C
Mean Temp: 27 °C
Precipitation: 116.9 mm
Humidity: 77%
Dew Point: 23 °C
Wind: 10 km/h
Pressure: 1014 mbar
Visibility: 17 km
December Climate & Weather Averages in San Juan
High Temp: 29 °C
Low Temp: 23 °C
Mean Temp: 26 °C
Precipitation: 82.5 mm
Humidity: 77%
Dew Point: 21 °C
Wind: 11 km/h
Pressure: 1016 mbar
Visibility: 17 km
Quick Climate Info | |
|---|---|
| Hottest Month | August (28 °C avg) |
| Coldest Month | January (25 °C avg) |
| Wettest Month | November (116.9 mm avg) |
| Windiest Month | July (14 km/h avg) |
| 875.0 mm (per year) | |
 It includes both the amount of rain and the amount of liquid water contained in frozen types of precipitation, such as snow or hail.”>Annual precip.
Weather by CustomWeather, © 2022
Need some help?
Climate: Puerto Rico: Temperatures, Climate graphs, climate tables for Puerto Rico
Puerto Rico in January
Puerto Rico in February
Puerto Rico in March
Puerto Rico in April
Puerto Rico in May
Puerto Rico in June
Puerto Rica in July
Puerto Rico in August
Puerto Rico in September
Puerto Rico in October
Puerto Rico in November
Puerto Rico in December
Puerto Rico has three different climates and is dominated by Af.
classification
| classification | account | Köppen Geiger | Examples |
|---|---|---|---|
| Equatorial | 57 | Af | adjuntas, San Sebastian, Utuado, barranquitas, Manati |
| Tropical savanna climate | 18 | Aw | Guanica, santa isabel, salinas, Guayama, Cabo Rojo |
| Tropical monsoon climate | 9 | Am | Hormigueros, Mayaguez, Rincon, Aguada, Aguadilla |
Adjuntas
The city of Adjuntas has a tropical climate. In winter, there is much less rainfall than in summer. This place is classified as Aw by Köppen and Geiger. In Adjuntas, the average annual temperature is 22.9 °C | The average annual rainfall is 1257 mm.
diagrams
Click one of the graphs for more information.
San Sebastian
This city has a tropical climate. The summers are much rainier than the winters in San Sebastián. The climate here is classified as Aw by the Köppen-Geiger system. In San Sebastián, the average annual temperature is 24.9 °C | The average annual rainfall is 1011 mm.
diagrams
Click one of the graphs for more information.
Utuado
Utuado has a tropical climate. Compared to winter, summer has much more rainfall. The Köppen-Geiger climate classification is Aw. In Utuado, the average annual temperature is 23.9 °C | About 1257 mm of precipitation falls annually.
diagrams
Click one of the graphs for more information.
Barranquitas
This city has a tropical climate. The summers are much rainier than the winters in Barranquitas. This place is classified as Aw by Köppen and Geiger. In Barranquitas, the average annual temperature is 23.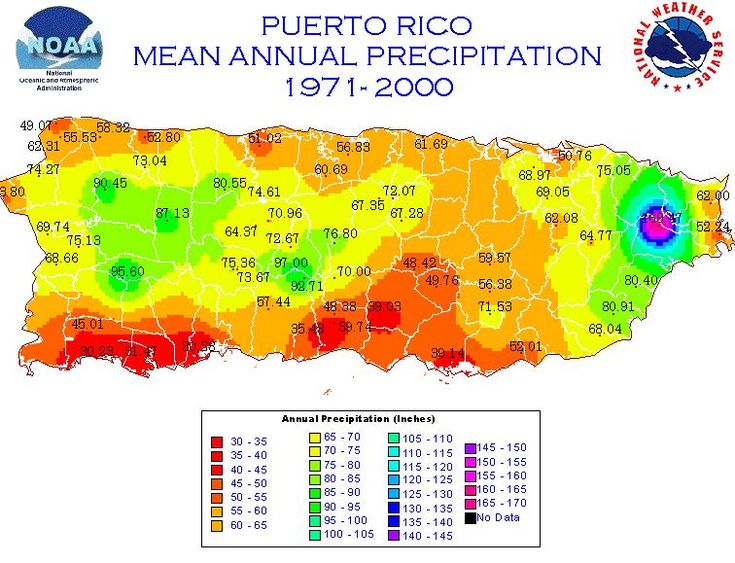 1 °C | Average annual rainfall – 1109mm.
diagrams
Click one of the graphs for more information.
Manati
This city has a tropical climate. The summers are much rainier than the winters in Manatí. The climate here is classified as Aw by the Köppen-Geiger system. In Manatí, the average annual temperature is 25.2 °C | The average annual rainfall is 1155 mm.
diagrams
Click one of the graphs for more information.
climate, information on climatic conditions in San Juan (Puerto Rico) from Meteo-TV
Maximum temperature, 1961-1990
| January | February | March | April | May | June | July | August | September | October | November | December |
|---|---|---|---|---|---|---|---|---|---|---|---|
| |||||||||||
Minimum temperature 1961-1990
| January | February | March | April | May | June | July | August | September | October | November | December |
|---|---|---|---|---|---|---|---|---|---|---|---|
| |||||||||||
Precipitation, mm, 1961-1990
| January | February | March | April | May | June | July | August | September | October | November | December |
|---|---|---|---|---|---|---|---|---|---|---|---|
| |||||||||||
Precipitation days 1961-1990
| January | February | March | April | May | June | July | August | September | October | November | December |
|---|---|---|---|---|---|---|---|---|---|---|---|
| |||||||||||
CLIMATE DATA
Climate information is the result of averaging data on meteorological parameters for the specified time periods.